NPP Products
This page provides a simple, visual comparison of NPP estimates for the various NPP
Products algorithms. What we hope is that these images will give users of these products
a general sense of how different estimated NPP distributions can be between models.
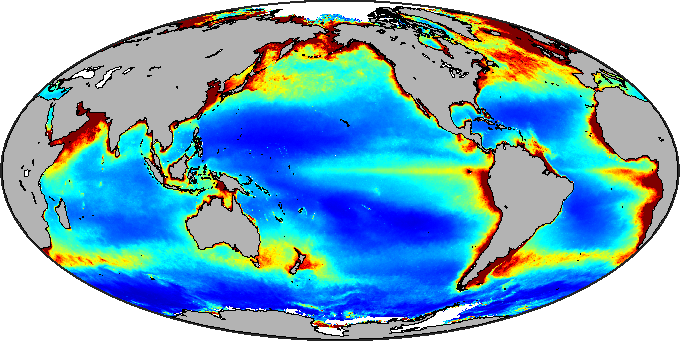
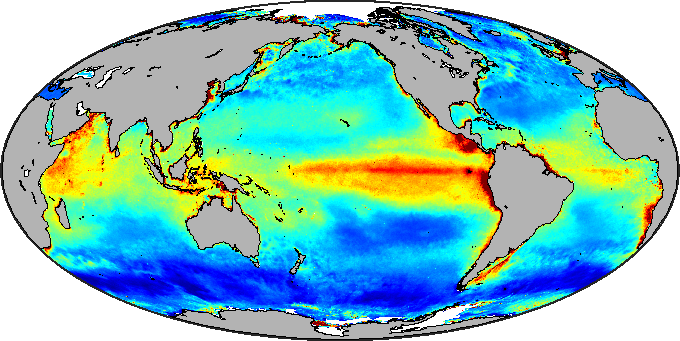
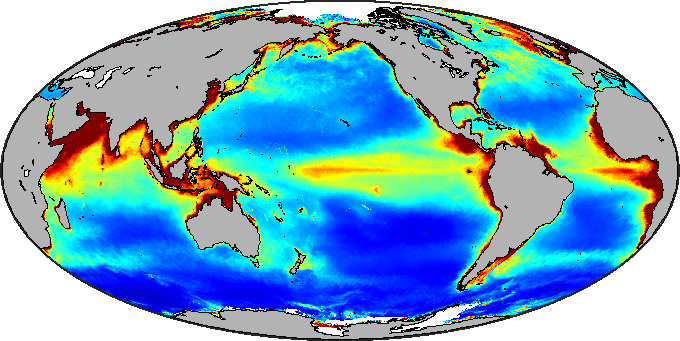
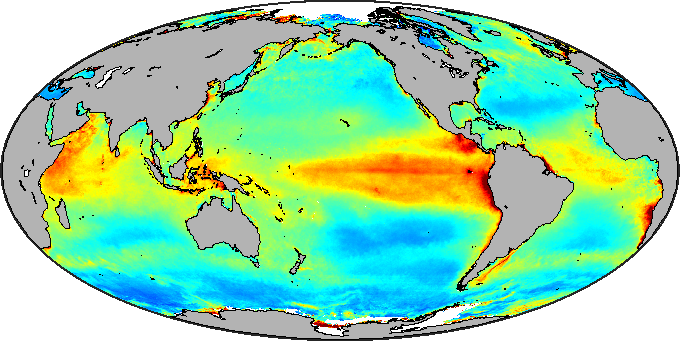
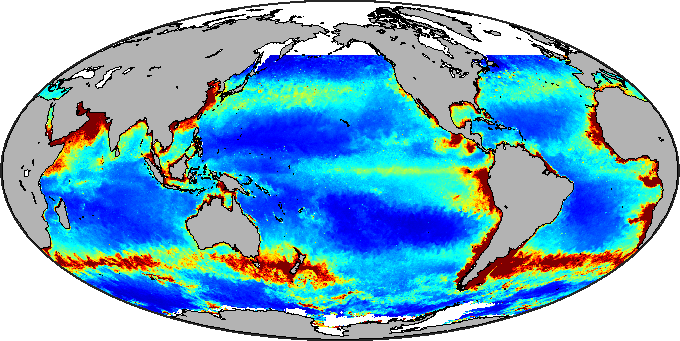
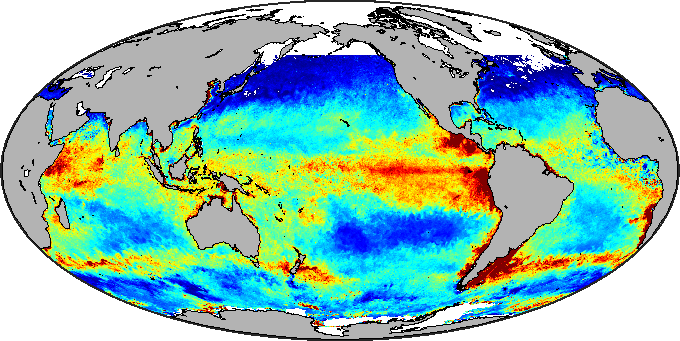
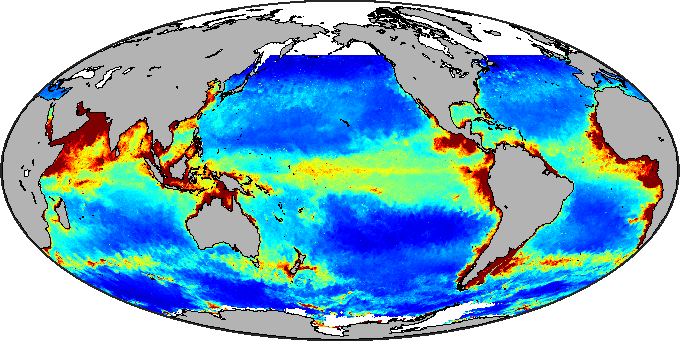
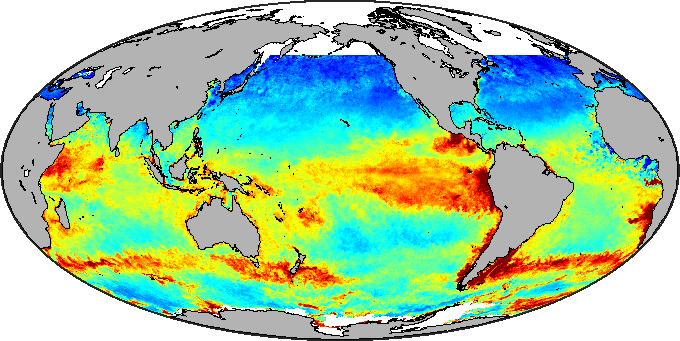
These visuals are all based on SeaWiFS data. The top panels provide a comparison of
Annual NPP distributions for the four models for the SeaWiFS data set.
These are then followed by comparisons of Monthly NPP distributions.
The annual
and monthly comparisons show larger figures, and covers 1998 through 2007 for SeaWiFS, 2003-2020 for MODIS, and 2012-2020 for VIIRS.
|